


In part 1 of this series, we simulated some data using the following model: 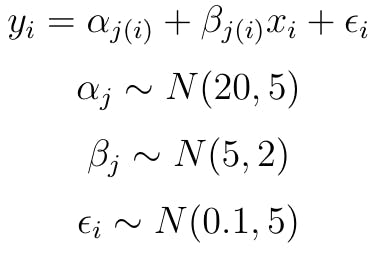 In this post, a mixed model with random intercept and random slope is fitted using
 pystan and simulated data. The nice thing about using the simulated data is that we already know the answer. The fitted model should return the parameters shown in the model specification above. Once the parameters are estimated, computing forecasts is trivial.
Here is the code that fits the mixed model using pystan:
import pystan
import pandas as pd
import numpy as np
import arviz as az
import matplotlib.pyplot as plt

rainfall_stan_model = """
data {
  int<lower=0> N;
  int<lower=0> J;
  vector[N] y;
  vector[N] x;
  int county[N];
}
parameters {
  real intercept_mu;
  real<lower=0> intercept_sigma;
  real slope_mu;
  real<lower=0> slope_sigma;
  real<lower=0> error_sigma;
  vector[J] intercept;
  vector[J] slope;

}

transformed parameters {

  vector[N] predicted_rainfall;

  for (i in 1:N)
    predicted_rainfall[i] <- intercept[county[i]] + x[i] * slope[county[i]];
}


model {
  intercept_mu ~ normal(0, 100);
  intercept_sigma ~ uniform(0, 100);
  slope_mu ~ normal(0, 100);
  slope_sigma ~ uniform(0, 100);
  error_sigma ~ uniform(0, 100);

  intercept ~ normal(intercept_mu, intercept_sigma);
  slope ~ normal(slope_mu, slope_sigma);
  y ~ normal(intercept[county] + slope[county].*x, error_sigma);
}
"""

rainfall_stan_compile = pystan.StanModel(model_code=rainfall_stan_model)

rainfall_stan_input_data = dict(
    N=len(simulated_data_df),
    J=len(states),
    county=simulated_data_df.state_numeric.values,
    x=simulated_data_df.year_numeric.values,
    y=simulated_data_df.rainfall.values,
)


rainfall_stan_fit = rainfall_stan_compile.sampling(
    data=rainfall_stan_input_data, iter=1000, chains=4
)
If you are new to Stan and unfamiliar with the syntax used to specify the model in the code above, please check out Stan’s documentation. As evident from the model string rainfall_stan_model, I am using diffused priors. In the real world, you would likely use more informative priors based on literature or expert opinions to fully exploit the power of Bayesian models. The code above compiles and fits the model. The estimated model is shown below:
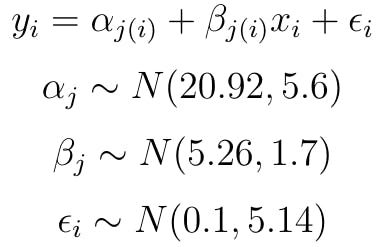 The estimated parameters are reasonably close. You can use the
 arviz library on the rainfall_stan_fit object to extract parameter estimates or to plot the distribution of each parameter (using az.plot_trace(rainfall_stan_fit)). But it is more instructive to look at the raw output for each iteration. The code below calls the to_dataframe() method of the rainfall_stan_fit object to extract the raw simulation data. Each run can then be averaged to estimate the parameters of the model.
import pandas as pd

states = ["AL", "AK", "AZ", "AR", "CA", "CO", "CT", "DC", "DE", "FL", "GA",
          "HI", "ID", "IL", "IN", "IA", "KS", "KY", "LA", "ME", "MD",
          "MA", "MI", "MN", "MS", "MO", "MT", "NE", "NV", "NH", "NJ",
          "NM", "NY", "NC", "ND", "OH", "OK", "OR", "PA", "RI", "SC",
          "SD", "TN", "TX", "UT", "VT", "VA", "WA", "WV", "WI", "WY"]

rainfall_stan_fit_df = rainfall_stan_fit.to_dataframe()
estimated_intercept = rainfall_stan_fit_df.iloc[:, range(8, 8 + 51)].mean().to_list()
estimated_slope = rainfall_stan_fit_df.iloc[:, range(59, 59 + 51)].mean().to_list()

all_estimates_zip = zip(states, estimated_intercept, estimated_slope)
all_estimates_df = pd.DataFrame(
    all_estimates_zip, columns=["states", "estimated_interecept", "estimated_slope"]
)

all_estimates_df.head(10)
The code above computes the estimates of intercept and slope for each state. The dataframe below shows the estimated intercept and slope for the first 10 states:
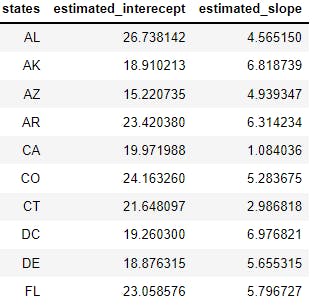
Once the intercept and slope for each state are estimated, it is straightforward to forecast rainfall for any state over any period. For example, the distribution of rainfall for the state of CA for the year 2025 or year_numeric = 16 is:
\(rainfall_{CA2025} \sim N(19.97 + 1.084 * 16, 5.14)\)