


I have been playing around with Data Classes as a substitute to namedtuples and I absolutely love it. Data Classes are a significant improvement over the namedtuples both in functionality and code readability. I won’t go into details of differences between namedtuples and dataclasses, please check out the wonderful talk by Raymond Hettinger on this topic. In this blog post I will show how to use Data Classes to store and transform data records as python objects.
Create a simple Data Class that holds open/close price of gold and silver.
from dataclasses import dataclass

@dataclass
class DailyOpenClose:
    __slots__ = ("gold_open", "gold_close", "silver_open", "silver_close")
    gold_open: float
    gold_close: float
    silver_open: float
    silver_close: float
Use the function below to import historical price data of gold and silver from Quandl API and convert it to dict, with date as a key and (open, close) as values.
import numpy as np
import quandl

quandl.ApiConfig.api_key = "****************"  # Enter your own Quandl API Key

def download_and_select_from_quandl(
    quandl_code: str, columns: list[str], date_column: str
) -> dict:
    """Download data from quandl, select required columns and convert numpy array to dictionary

    Args:
        quandl_code (str): A string that uniquely identifies quandl dataset
        columns (list): A list of selected column names. Column names must be str
        date_column (str): A string identifying date column in the Quandl dataset

    Returns:
        dict: A dictionary with key = date and values = tuple of selected columns
    """

    input_data = quandl.get(quandl_code, type="raw", returns="numpy")

    output_dict = dict()

    for quandl_column in input_data:
        output_dict[quandl_column[date_column]] = tuple(
            [quandl_column[column] for column in columns]
        )

    return output_dict

gold_quandl = download_and_select_from_quandl(
    "CHRIS/CME_GC1", ["Open", "Settle"], date_column="Date"
)
silver_quandl = download_and_select_from_quandl(
    "CHRIS/CME_SI1", ["Open", "Settle"], date_column="Date"
)
gold_quandl and silver_quandl are dictionaries with dates as key and tuple of open & close as values. The function below merges these two dictionaries and creates instance of class DailyOpenClose as data records. The DailyOpenClose object holds date, open and close for both silver and gold.
def merge_two_assets(
    asset1_dict: dict, asset2_dict: dict, start_date: np.datetime64
) -> dict:
    """Merge price data of two assets

    Args:
        asset1_dict (dict): A dictionary of price data with key = Date and values = tuple of open/close
        asset2_dict (dict): A dictionary of price data with key = Date and values = tuple of open/close
        start_date (datetime): Filter by given date

    Returns:
        dict: A dictionary of merged assets
    """
    return {
        key: DailyOpenClose(*asset1_dict.get(key), *asset2_dict.get(key))
        for key in asset1_dict
        if key > start_date
    }

gold_silver_open_close = merge_two_assets(
    gold_quandl,
    silver_quandl,
    start_date=np.datetime64("2021-01-01T00:00:00.000000000"),
)
gold_silver_open_close is a dict with dates as key and instance of DailyCloseOpen as values. The daily open/close price of silver and gold is stored in Data Classes as a data record. The output below shows last 5 data records of gold_silver_open_close dictionary:
{numpy.datetime64('2021-05-24T00:00:00.000000000'): DailyOpenClose(gold_open=1883.5, gold_close=1884.5, silver_open=27.885, silver_close=27.887),

numpy.datetime64('2021-05-25T00:00:00.000000000'): DailyOpenClose(gold_open=1881.2, gold_close=1898.0, silver_open=27.75, silver_close=28.037),

numpy.datetime64('2021-05-26T00:00:00.000000000'): DailyOpenClose(gold_open=1900.0, gold_close=1901.2, silver_open=nan, silver_close=27.853),

numpy.datetime64('2021-05-27T00:00:00.000000000'): DailyOpenClose(gold_open=1896.8, gold_close=1895.7, silver_open=27.765, silver_close=27.94),

numpy.datetime64('2021-05-28T00:00:00.000000000'): DailyOpenClose(gold_open=1897.5, gold_close=1902.5, silver_open=27.98, silver_close=28.014)}
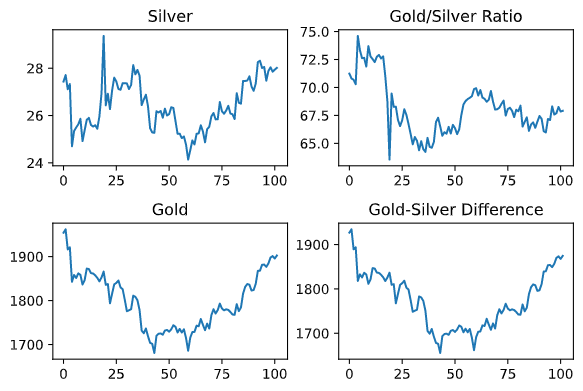
The merged dictionary of gold and silver can then be used to perform desired transformations. For example, the code below plots daily close of gold and silver, it also plots the ratio of gold/silver and difference between gold and silver.
import matplotlib.pyplot as plt

fig, ax = plt.subplots(2, 2)
ax[0, 0].plot([values.silver_close for key, values in gold_silver_open_close.items()])
ax[0, 0].set(title="Silver")
ax[0, 1].plot(
    [
        values.gold_close / values.silver_close
        for key, values in gold_silver_open_close.items()
    ]
)
ax[0, 1].set(title="Gold/Silver Ratio")
ax[1, 0].plot([values.gold_close for key, values in gold_silver_open_close.items()])
ax[1, 0].set(title="Gold")
ax[1, 1].plot(
    [
        values.gold_close - values.silver_close
        for key, values in gold_silver_open_close.items()
    ]
)
ax[1, 1].set(title="Gold-Silver Difference")
plt.tight_layout(pad=0.4, w_pad=0.5, h_pad=1.0)
PS: The cover image is of Smith Rock in Central Oregon